Example Scenario
Konfigurator Operator looks for KonfiguratorTemplate Custom Resource in the namespaces specified, render the configuration and then mount these configmaps/secrets to the specified resource.
In this example we will generate fluentd configurations dynamically so that our application specific logs can be parsed.
Our application service nordmart-catalog is a java application that generate logs of the following format:
2019-11-27 11:04:12.682 INFO 1 --- [nio-8080-exec-1] o.s.web.servlet.DispatcherServlet : Initializing Servlet 'dispatcherServlet'
and the regex to parse this log line:
/^(?<time>\d+(?:-\d+){2}\s+\d+(?::\d+){2}.\d+)\s*(?<level>\S+) (?<pid>\d+) --- \[(?<thread>[\s\S]*?)\] (?<class>\S+)\s*:\s*(?<message>[\s\S]*?)(?=\g<time>|\Z)/
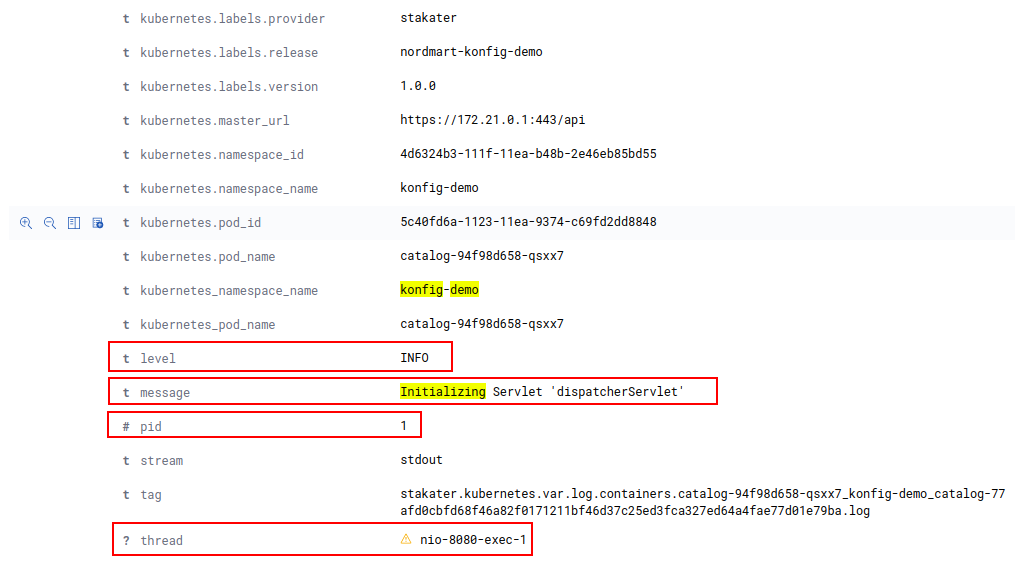
Before Parsing
Raw logs are being pushed in elasticsearch and are seen unparsed as below: 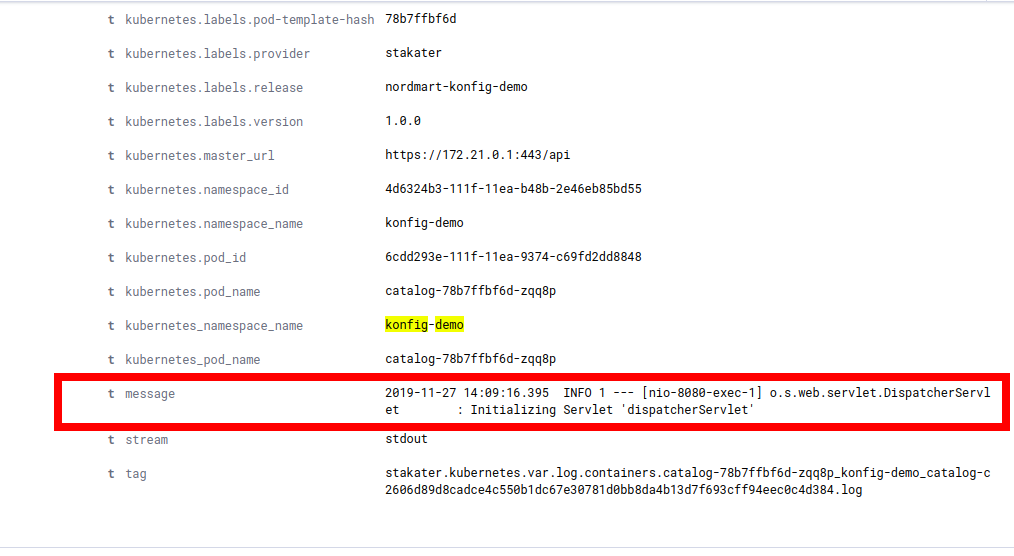
Steps
- Deploy Konfigurator Operator (already running in namespace
logging) - Deploy KonfiguratorTemplate resource for templating fluentd config.
- Verify rendered configmap
konfigurator-stakater-logging-fluentd-elasticsearch-renderedinloggingnamespace without sample app config. - Deploy a sample application with regex to be used by Konfigurator in a separate namespace.
- Konfigurator will read the newly created resource and render the new config.
Reloaderwill reload the pods as soon as the config is updated.
Deploy Konfigurator Operator
Konfigurator Operator is already deployed with following values in logging namespace.
apiVersion: helm.fluxcd.io/v1
kind: HelmRelease
metadata:
  name: stakater-logging-konfigurator
  namespace: logging
spec:
  releaseName: stakater-logging-konfigurator
  chart:
    repository: https://stakater.github.io/stakater-charts/
    name: konfigurator
    version: 0.0.20
  values:
    kubernetes:
      host: https://kubernetes.default

    konfigurator:
      deployCRD: true
      labels:
        provider: stakater
        group: com.stakater.platform
        version: v0.0.20
      image:
        name: stakater/konfigurator
        tag: "v0.0.20"
        pullPolicy: IfNotPresent
      env:
      - name: WATCH_NAMESPACE
        valueFrom:
          fieldRef:
            fieldPath: metadata.namespace
Konfigurator Operator creates CRD (Custom Resource Definition) konfiguratorTemplate and watches resources of this type in namespaces. You can view the CRD via running this command
kubectl describe crd konfiguratortemplates.konfigurator.stakater.com
Deploy KonfiguratorTemplate resource
Following is a Konfigurator Template that will templatize fluent.conf and mounts the template as a configMap on the stakater-logging-fluentd-elasticsearch DaemonSet so that the fluentd pod can use this config. Save the following manifest in a file named fluent-template.yaml and apply by running
kubectl apply -f https://raw.githubusercontent.com/stakater/Playbook/master/content/workshop/konfigurator/yaml/konfigTemplate-logging.yaml
Verify rendered configmap
konfigurator-stakater-logging-fluentd-elasticsearch-rendered can be seen in configMaps in logging namespace. This fluentd config will contain filters for different applications whose regex were provided in their pod annotations.
Deploy a sample application
- Create a separate namespace
konfig-demo
kubectl create namespace konfig-demo
- Use the following manifest to deploy a sample nordmart application named
nordmart-konfig-demowith regex passed undervalues.deployment.fluentdConfigAnnotations.
kubectl apply -f https://raw.githubusercontent.com/stakater/Playbook/master/content/workshop/konfigurator/yaml/catalog.yaml
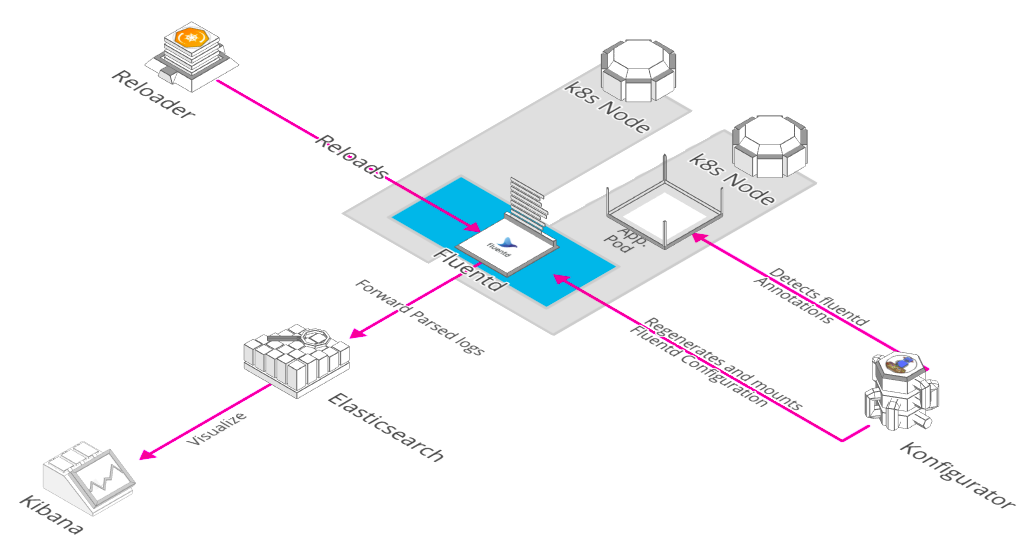
Konfigurator in action
Konfigurator operator in logging namespace will read the annotations from the newly created pod and generate the fluentd config with name konfigurator-stakater-logging-fluentd-elasticsearch-rendered and mounts the new configMap on stakater-logging-fluentd-elasticsearch DaemonSet in logging namespace.
Verify that the newly rendered fluentd configMap has entry for konfig-demo by running the following
kubectl describe configmap konfigurator-stakater-logging-fluentd-elasticsearch-rendered -n logging
From K8s dashboard: 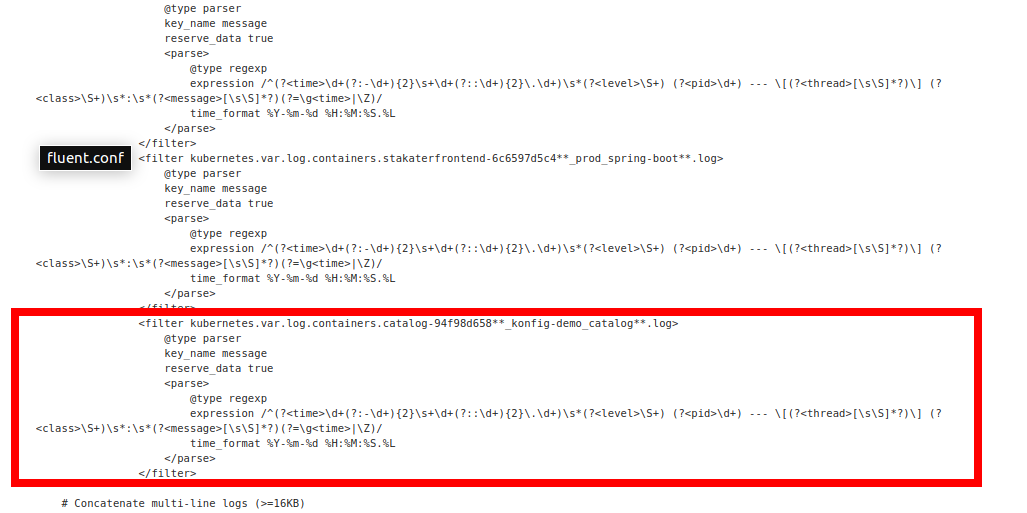
Reloader reloads DaemonSet/Pods
Reloader operator running in the control namespace will rollout the daemonset with the new configMap mounted because of the following annotation on stakater-fluentd-elasticsearch daemonset.
configmap.reloader.stakater.com/reload: konfigurator-stakater-logging-fluentd-elasticsearch-rendered
Complete stakater-fluentd-elasticsearch manifest is as follows:
apiVersion: helm.fluxcd.io/v1
kind: HelmRelease
metadata:
  name: stakater-logging-fluentd-elasticsearch
  namespace: logging
spec:
  releaseName: stakater-logging-fluentd-elasticsearch
  chart:
    repository: https://kiwigrid.github.io
    name: fluentd-elasticsearch
    version: 4.9.1
  values:
    image:
      pullPolicy: Always
      repository: stakater/fluentd-elasticsearch
      tag: v1.0.0

    awsSigningSidecar:
      enabled: false
      image:
        repository: abutaha/aws-es-proxy
        tag: 0.9

    priorityClassName:
    hostLogDir:
      dockerContainers: /var/lib/docker/containers
      libSystemdDir: /usr/lib64
      varLog: /var/log

    resources:
      {}

    elasticsearch:
      auth:
        enabled: false
        password: yourPass
        user: yourUser
      bufferChunkLimit: 2M
      bufferQueueLimit: 8
      host: elasticsearch-client.logging
      logLevel: info
      logstashPrefix: logstash
      path: ""
      port: 9200
      scheme: http
      sslVerify: false
      sslVersion: TLSv1_2
      typeName: _doc

    fluentdArgs: --no-supervisor -q
    env:
      {}

    secret:
      {}

    rbac:
      create: true

    serviceAccount:
      create: true
      name: ""

    podSecurityPolicy:
      annotations: {}
      enabled: false

    livenessProbe:
      enabled: false

    annotations:
      configmap.reloader.stakater.com/reload: konfigurator-stakater-logging-fluentd-elasticsearch-rendered,stakater-fluentd-elasticsearch

    podAnnotations:
      prometheus.io/port: "24231"
      prometheus.io/scrape: "true"

    updateStrategy:
      type: RollingUpdate

    tolerations:
      - effect: NoSchedule
        key: node-role.kubernetes.io/master
        operator: Exists

    affinity:
      {}

    nodeSelector:
      {}

    service:
      ports:
      - name: monitor-agent
        port: 24231
        type: ClusterIP

    serviceMonitor:
      enabled: false
      interval: 10s
      labels: {}
      path: /metrics
      port: 24231

    prometheusRule:
      enabled: false
      labels: {}
      prometheusNamespace: monitoring

    configMaps:
      useDefaults:
        containersInputConf: true
        forwardInputConf: true
        monitoringConf: true
        outputConf: false
        systemConf: true
        systemInputConf: true

    extraConfigMaps:
      output.conf: |
        # Empty Output conf

    extraVolumes:
      - hostPath:
          path: /var/data
        name: vardata

    extraVolumeMounts:
      - mountPath: /var/data
        name: vardata
        readOnly: true
Reloader details can be found here
After Parsing
After dynamic generation and parsing of the logs the parsed log entry can be seen as below: